Carbon Gas Emissions (CO2 and CH4) in Coastal Community Settlement Area in The Mawasangka District - Central Buton, Indonesia
DOI:
https://doi.org/10.22452/mjs.vol44no3.2Keywords:
Carbon gas emission, settlement area, methane, global warmingAbstract
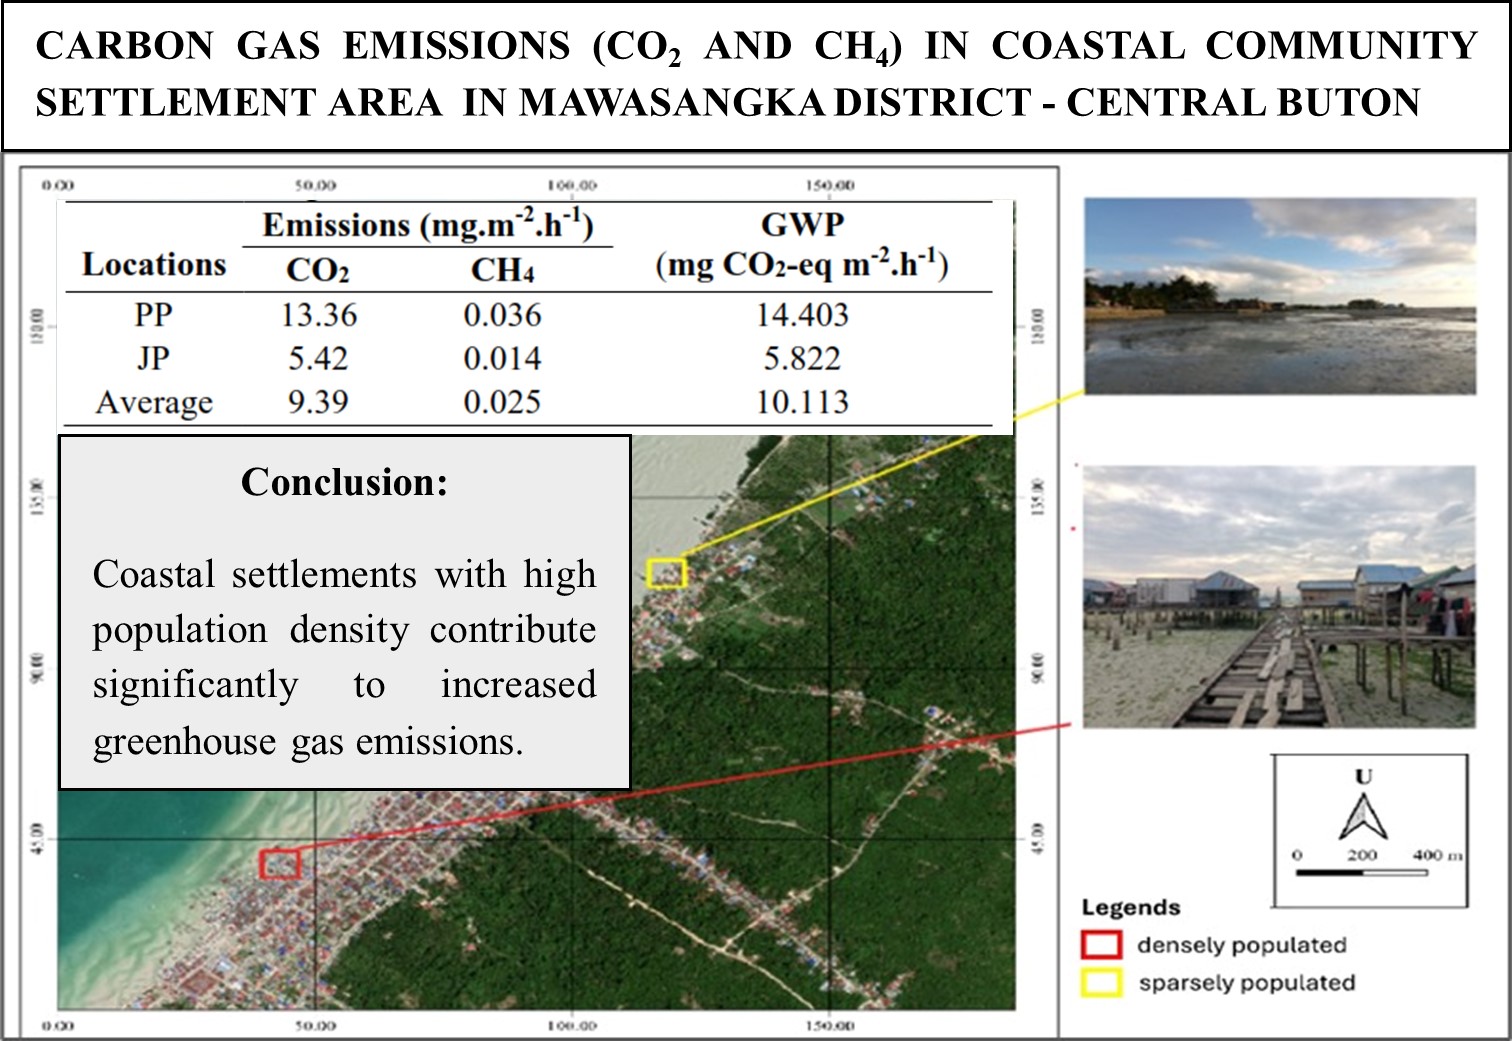
Coastal communities build settlements on the sea in coastal areas. The resulting waste is disposed of in residential areas and undergoes decomposition, which triggers the release of carbon gas. This study aims to analyze carbon gas emissions that occur in residential areas. The gas extraction method uses a hood placed in a densely populated area (PP) and sparsely populated (JP). Gas concentration analysis used the gas chromatography (GC-MS) method. Analysis of differences in gas concentrations in the two regions was tested by ANOVA-single factor. The average concentration of CO2 gas in the two residential areas (PP and JP) was significantly different (P-value = 0.000067 <0.05), while the average concentration of CH4 gas was not significantly different (P-value = 0.1721 > 0.05). CO2 emissions in densely populated areas (PP) are 13.36 mg.m-2.h-1 and higher than sparsely populated areas (JP), which are 5.42 mg.m-2.h-1. These values are significantly different (P-value = 0.00071 <0.05). Meanwhile, CH4 gas emissions in the PP area (0.036 mg.m-2.h-1) are greater than those in the JP area (0.014 mg.m-2.h-1). These values are also significantly different (P-value = 0.03 <0.05). The PP area GWP value is 14.403 mg.CO2-eq m-2.h-1. This value is greater than the GWP value in the JP areas, which is 5.822 mg.CO2-eq.m-2.h-1. It Indicates that settlements in the coastal area of Mawasangka Subdistrict make a significant contribution to increasing greenhouse gas emissions in the atmosphere, especially CO2 gas. Total greenhouse gas emissions and GWP from carbon gases must be controlled so they do not increase.
References
Asch RG, Cheung WWL, Reygondeau G. 2007. Future marine ecosystem drivers, biodiversity, and fisheries maximum catch potential in Pacific Island countries and territories under climate change. Mar Pol; http://dx.doi.org/10.1016/j.marpol.2017.08.015.
Badjeck MC, Allison EH, Halls AS, Dulvy NK. 2010. Impacts of climate variability and change on fishery-based livelihoods. Mar Pol 2010; 34: 375 – 83.
Biswas H, Mukhopadhyay SK, Sen S, Jana TK. 2007. Spatial and temporal pattern of methane dynamics in the tropical mangrove dominated estuary, NE coast of Bay of Bengal, India. J Mar Syst; 68: 55 – 64.
Brander K. 2010. Impacts of climate change on fisheries. J Mar Sys. 79: 389 – 402.
Cabezaz A, Mitsch WJ, MacDonnel C, Zhang L, Bydalek F, Lasso A. 2017. Methane emissions from mangrove soils in hydrologically disturbed and reference mangrove tidal creeks in southwest Florida. Ecol Engine; http://dx.doi.org/10.1016/j.ecoleng.2017.08.041
Dutta MK, Chowdhury C, Jana TK, Mukhopadhyay SK. 2013. Dynamics and exchange fluxes of methane in the estuarine mangrove environment of the Sundarbans, NE coast of India. Atmos Environ; 77: 631 – 39.
I.P.C.C. Climate Change. 2001. The Intergovernmental panel on climate change a scientific basis. Cambridge UK: Cambridge University Press.
Jones PD. 2013. Greenhouse effect and climate data. Reference Mod Earth Syst Environ Sci. 1 – 17.
Lin CW., Kao YC., Chou MC., Wu HH., Ho CW., Lin HJ. 2020. Methane emissions from subtropical and tropical mangrove ecosystems in Taiwan. Forests. 11 (470): doi:10.3390/f11040470
Lovelock CE., Ruess RW., Feller IC. 2011. CO2 efflux from cleared mangrove peat. PLoS ONE 6 (6), e21279.
Rahman, Yulianda F, Rusmana I, Wardiatno Y. 2018. Fluxes of greenhouse gases CO2, CH4, and N2O from mangrove soil in Tallo River, Makassar. J Trop Biol; 18: 149 – 58.
Rahman, Wardiatno, Y., Yulianda, F., Rusmana, I., 2020a. Seasonal fluxes of CO2, CH4, and N2O greenhouse gases in various mangrove species on the coast of West Muna Regency, Southeast Sulawesi, Indonesia. Plant Archives. 20(2): 4301 – 4311.
Rahman, Effendi H, Yulianda F, Rusmana I, Wardiatno Y, Bengen DGB. 2020b. Metode dan Analisis Studi Ekosistem Mangrove. IPB Press. 124p.
Shawket N, Elmadhi Y, Kharrim KE, Belghyti D. 2019. Impacts of climate change on fish performance. J Entomol Zoo Stud; 7: 343 – 49.
Wang H, Zhou S, Li X, Liu H, Chi D, Xu K. 2016. The influence of climate change and human activities on ecosystem service value. Ecol Engin. 87: 224 – 39.
Downloads
Published
Issue
Section
License
Copyright (c) 2025 Malaysian Journal of Science

This work is licensed under a Creative Commons Attribution-NonCommercial 4.0 International License.
Transfer of Copyrights
- In the event of publication of the manuscript entitled [INSERT MANUSCRIPT TITLE AND REF NO.] in the Malaysian Journal of Science, I hereby transfer copyrights of the manuscript title, abstract and contents to the Malaysian Journal of Science and the Faculty of Science, University of Malaya (as the publisher) for the full legal term of copyright and any renewals thereof throughout the world in any format, and any media for communication.
Conditions of Publication
- I hereby state that this manuscript to be published is an original work, unpublished in any form prior and I have obtained the necessary permission for the reproduction (or am the owner) of any images, illustrations, tables, charts, figures, maps, photographs and other visual materials of whom the copyrights is owned by a third party.
- This manuscript contains no statements that are contradictory to the relevant local and international laws or that infringes on the rights of others.
- I agree to indemnify the Malaysian Journal of Science and the Faculty of Science, University of Malaya (as the publisher) in the event of any claims that arise in regards to the above conditions and assume full liability on the published manuscript.
Reviewer’s Responsibilities
- Reviewers must treat the manuscripts received for reviewing process as confidential. It must not be shown or discussed with others without the authorization from the editor of MJS.
- Reviewers assigned must not have conflicts of interest with respect to the original work, the authors of the article or the research funding.
- Reviewers should judge or evaluate the manuscripts objective as possible. The feedback from the reviewers should be express clearly with supporting arguments.
- If the assigned reviewer considers themselves not able to complete the review of the manuscript, they must communicate with the editor, so that the manuscript could be sent to another suitable reviewer.
Copyright: Rights of the Author(s)
- Effective 2007, it will become the policy of the Malaysian Journal of Science (published by the Faculty of Science, University of Malaya) to obtain copyrights of all manuscripts published. This is to facilitate:
- Protection against copyright infringement of the manuscript through copyright breaches or piracy.
- Timely handling of reproduction requests from authorized third parties that are addressed directly to the Faculty of Science, University of Malaya.
- As the author, you may publish the fore-mentioned manuscript, whole or any part thereof, provided acknowledgement regarding copyright notice and reference to first publication in the Malaysian Journal of Science and Faculty of Science, University of Malaya (as the publishers) are given. You may produce copies of your manuscript, whole or any part thereof, for teaching purposes or to be provided, on individual basis, to fellow researchers.
- You may include the fore-mentioned manuscript, whole or any part thereof, electronically on a secure network at your affiliated institution, provided acknowledgement regarding copyright notice and reference to first publication in the Malaysian Journal of Science and Faculty of Science, University of Malaya (as the publishers) are given.
- You may include the fore-mentioned manuscript, whole or any part thereof, on the World Wide Web, provided acknowledgement regarding copyright notice and reference to first publication in the Malaysian Journal of Science and Faculty of Science, University of Malaya (as the publishers) are given.
- In the event that your manuscript, whole or any part thereof, has been requested to be reproduced, for any purpose or in any form approved by the Malaysian Journal of Science and Faculty of Science, University of Malaya (as the publishers), you will be informed. It is requested that any changes to your contact details (especially e-mail addresses) are made known.
Copyright: Role and responsibility of the Author(s)
- In the event of the manuscript to be published in the Malaysian Journal of Science contains materials copyrighted to others prior, it is the responsibility of current author(s) to obtain written permission from the copyright owner or owners.
- This written permission should be submitted with the proof-copy of the manuscript to be published in the Malaysian Journal of Science
Licensing Policy
Malaysian Journal of Science is an open-access journal that follows the Creative Commons Attribution-Non-commercial 4.0 International License (CC BY-NC 4.0)
CC BY – NC 4.0: Under this licence, the reusers to distribute, remix, alter, and build upon the content in any media or format for non-commercial purposes only, as long as proper acknowledgement is given to the authors of the original work. Please take the time to read the whole licence agreement (https://creativecommons.org/licenses/by-nc/4.0/legalcode ).


